Shortly after World War II, margarine replaced butter in the U.S. food supply. Margarine consumption exceeded butter in the 1950s. By 1975, we were eating one-fourth the amount of butter eaten in 1900 and ten times the amount of margarine. Margarine was made primarily of hydrogenated vegetable oils, as many still are today. This makes it one of our primary sources of trans fat. The consumption of trans fats from other sources also likely tracked closely with margarine intake.
Coronary heart disease (CHD) resulting in a loss of blood flow to the heart (heart attack), was first described in detail in 1912 by Dr. James B. Herrick. Sudden cardiac death due to CHD was considered rare in the 19th century, although other forms of heart disease were diagnosed regularly by symptoms and autopsies. They remain rare in many non-industrial cultures today. This could not have resulted from massive underdiagnosis because heart attacks have characteristic symptoms, such as chest pain that extends along the arm or neck. Physicians up to that time were regularly diagnosing heart conditions other than CHD. The following graph is of total heart disease mortality in the U.S. from 1900 to 2005. It represents all types of heart disease mortality, including 'heart failure', which are non-CHD disorders like arrhythmia and myocarditis.
The graph above is not age-adjusted, meaning it doesn't reflect the fact that lifespan has increased since 1900. I couldn't compile the raw data myself without a lot of effort, but the age-adjusted graph is here. It looks similar to the one above, just a bit less pronounced. I think it's interesting to note the close similarity between the graph of margarine intake and the graph of heart disease deaths. The butter intake graph is also essentially the inverse of the heart disease graph.
Here's where it gets really interesting. The U.S. Centers for Disease Control has also been tracking CHD deaths specifically since 1900. Again, it would be a lot of work for me to compile the raw data, but it can be found here and a graph is in Anthony Colpo's book The Great Cholesterol Con. Here's the jist of it: there was essentially no CHD mortality until 1925, at which point it skyrocketed until about 1970, becoming the leading cause of death. After that, it began to fall due to improved medical care. There are some discontinuities in the data due to changes in diagnostic criteria, but even subtracting those, the pattern is crystal clear.
The age-adjusted heart disease death rate (all forms of heart disease) has been falling since the 1950s, largely due to improved medical treatment. Heart disease incidence has not declined substantially, according to the Framingham Heart study. We're better at keeping people alive in the 21st century, but we haven't successfully addressed the root cause of heart disease.
Was the shift from butter to margarine involved in the CHD epidemic? We can't make any firm conclusions from these data, because they're purely correlations. But there are nevertheless mechanisms that support a protective role for butter, and a detrimental one for margarine. Butter from pastured cows is one of the richest known sources of vitamin K2. Vitamin K2 plays a central role in protecting against arterial calcification, which is an integral part of arterial plaque and the best single predictor of cardiovascular death risk. In the early 20th century, butter was typically from pastured cows.
Margarine is a major source of trans fat. Trans fat is typically found in vegetable oil that has been hydrogenated, rendering it solid at room temperature. Hydrogenation is a chemical reaction that is truly disgusting. It involves heat, oil, hydrogen gas and a metal catalyst. I hope you give a wide berth to any food that says "hydrogenated" anywhere in the ingredients. Some modern margarine is supposedly free of trans fats, but in the U.S., less than 0.5 grams per serving can be rounded down so the nutrition label is not a reliable guide. Only by looking at the ingredients can you be sure that the oils haven't been hydrogenated. Even if they aren't, I still don't recommend margarine, which is an industrially processed pseudo-food.
One of the strongest explanations of CHD is the oxidized LDL hypothesis. The idea is that LDL lipoprotein particles ("LDL cholesterol") become oxidized and stick to the vessel walls, creating an inflammatory cascade that results in plaque formation. Chris Masterjohn wrote a nice explanation of the theory here. Several things influence the amount of oxidized LDL in the blood, including the total amount of LDL in the blood, the antioxidant content of the particle, the polyunsaturated fat content of LDL (more PUFA = more oxidation), and the size of the LDL particles. Small LDL is considered more easily oxidized than large LDL. Small LDL is also associated with elevated CHD mortality. Trans fat shrinks your LDL compared to butter.
In my opinion, it's likely that both the decrease in butter consumption and the increase in trans fat consumption contributed to the massive incidence of CHD seen in the U.S. and other industrial nations today. I think it's worth noting that France has the highest per-capita dairy fat consumption of any industrial nation, along with a comparatively low intake of hydrogenated fat, and also has the second-lowest rate of CHD, behind Japan.
Saturday, December 27, 2008
Friday, December 26, 2008
Leptin Resistance and Sugar
Leptin is a major hormone regulator of fat mass in vertebrates. It's a frequent topic on this blog because I believe it's central to overweight and modern metabolic disorders. Here's how it works. Leptin is secreted by fat tissue, and its blood levels are proportional to fat mass. The more fat tissue, the more leptin. Leptin reduces appetite, increases fat release from fat tissue and increases the metabolic rate. Normally, this creates a "feedback loop" that keeps fat mass within a fairly narrow range. Any increase in fat tissue causes an increase in leptin, which burns fat tissue at an accelerated rate. This continues until fat mass has decreased enough to return leptin to its original level.
Leptin was first identified through research on the "obese" mutant mouse. The obese strain arose by a spontaneous mutation, and is extremely fat. The mutation turned out to be in a protein investigators dubbed leptin. When researchers first discovered leptin, they speculated that it could be the "obesity gene", and supplemental leptin a potential treatment for obesity. They later discovered (to their great chagrin) that obese people produce much more leptin than thin people, so a defeciency of leptin was clearly not the problem, as it was in the obese mouse. They subsequently found that obese people scarcely respond to injected leptin by reducing their food intake, as thin people do. They are leptin resistant. This makes sense if you think about it. The only way a person can gain significant fat mass is if the leptin feedback loop isn't working correctly.
Another rodent model of leptin resistance arose later, the "Zucker fatty" rat. Zucker rats have a mutation in the leptin receptor gene. They secrete leptin just fine, but they don't respond to it because they have no functional receptor. This makes them an excellent model of complete leptin resistance. What happens to Zucker rats? They become obese, hypometabolic, hyperphagic, hypertensive, insulin resistant, and they develop blood lipid disturbances. It should sound familiar; it's the metabolic syndrome and it affects 24% of Americans (CDC NHANES III). Guess what's the first symptom of impending metabolic syndrome in humans, even before insulin resistance and obesity? Leptin resistance. This makes leptin an excellent contender for the keystone position in overweight and other metabolic disorders.
I've mentioned before that the two most commonly used animal models of the metabolic syndrome are both sugar-fed rats. Fructose, which accounts for 50% of table sugar and 55% of high-fructose corn syrup, is probably the culprit. Glucose, which is the remainder of table sugar and high-fructose corn syrup, and the product of starch digestion, does not have the same effects. I think it's also relevant that refined sugar contains no vitamins or minerals whatsoever. Sweetener consumption in the U.S. has increased from virtually nothing in 1850, to 84 pounds per year in 1909, to 119 pounds in 1970, to 142 pounds in 2005 (source).
In a recent paper, Dr. Philip Scarpace's group (in collaboration with Dr. Richard Johnson), showed that a high-fructose diet causes leptin resistance in rats. The diet was 60% fructose, which is extreme by any standards, but it caused a complete resistance to the effect of leptin on food intake. Normally, leptin binds receptors in a brain region called the hypothalamus, which is responsible for food intake behaviors (including in humans). This accounts for leptin's ability to reduce food consumption. Fructose-fed rats did not reduce their food intake at all when injected with leptin, while rats on a normal diet did. When subsequently put on a high-fat diet (60% lard), rats that started off on the fructose diet gained more weight.
I think it's worth mentionong that rodents don't respond to high-fat diets in the same way as humans, as judged by the efficacy of low-carbohydrate diets for weight loss. Industrial lard also has a very poor ratio of omega-6 to omega-3 fats (especially if it's hydrogenated), which may also contribute to the observed weight gain.
Fructose-fed rats had higher cholesterol and twice the triglycerides of control-fed rats. Fructose increases triglycerides because it goes straight to the liver, which makes it into fat that's subsequently exported into the bloodstream. Elevated triglycerides impair leptin transport from the blood to the hypothalamus across the blood-brain barrier, which separates the central nervous system from the rest of the body. Fructose also impaired the response of the hypothalamus to the leptin that did reach it. Both effects may contribute to the leptin resistance Dr. Scarpace's group observed.
Just four weeks of fructose feeding in humans (1.5g per kg body weight) increased leptin levels by 48%. Body weight did not change during the study, indicating that more leptin was required to maintain the same level of fat mass. This may be the beginning of leptin resistance.
Thursday, December 25, 2008
The Fundamentals
I heard an interview of Michael Pollan yesterday on Talk of the Nation. He made some important points about nutrition that bear repeating. He's fond of saying "don't eat anything your grandmother wouldn't recognize as food". That doesn't mean your grandmother specifically, but anyone's grandmother, whether she was Japanese, American or African. The point is that commercial food processing has taken us away from the foods, and traditional food preparation methods, on which our bodies evolved to thrive. At this point, we don't know enough about health to design a healthy synthetic diet. Diet and health are too complex for reductionism at our current level of understanding. For that reason, any departure from natural foods and traditional food processing techniques is suspect.
Mainstream nutrition science has repeatedly contradicted itself and led us down the wrong path. This means that traditional cultures still have something to teach us about health. Hunter-gatherers and certain other non-industrial cultures are still the healthiest people on Earth, from the perspective of non-communicable disease. Pollan used the example of butter. First we thought it was healthy, then we were told it contains too much saturated fat and should be replaced with hydrogenated vegetable margarine. Now we learn that trans fats are unhealthy, so we're making new margarines that are low in trans fats, but are still industrially processed pseudo-foods. How long will it take to show these new fats are harmful? What will be the next industrial fat to replace them? This game can be played forever as the latest unproven processed food replaces the previous one, and it will never result in something as healthy as real butter.
The last point of Pollan's I'll mention is that the world contains (or contained) a diversity of different cultures, living in dramatically different ways, many of which do not suffer from degenerative disease. These range from carnivores like the Inuit, to plant-heavy agriculturalists like the Kitavans, to pastoralists like the Masai. The human body is adapted to a wide variety of foodways, but the one it doesn't seem to like is the modern Western diet.
Pollan's new book is In Defense of Food. I haven't read it, but I think it would be a good introduction to the health, ethical and environmental issues that surround food choices. He's a clear and accessible writer.
Merry Christmas, happy Hanukkah, and happy holidays to everyone!
Sunday, December 14, 2008
U.S. Weight, Lifestyle and Diet Trends, 1970- 2007
For this post, I compiled statistics on U.S. weight, health and lifestyle trends, and graphed them as consistently as possible. They span the period from 1970 to 2007, during which the obesity rate doubled. The data come from the National Health and Nutrition Examination Survey (NHANES), the Behavioral Risk Factor Surveillance System (BRFSS), and the U.S. Department of Agriculture (USDA). Some of the graphs are incomplete, either because the data don't exist, or because I wasn't able to find them. Obesity is defined as a body mass index (BMI) of 30+; overweight is a BMI of 25+. Yes, it's frightening. It has affected adults and children (NHANES).
The percentage of Americans who report exercising in their spare time has actually increased since 1988 (BRFSS).
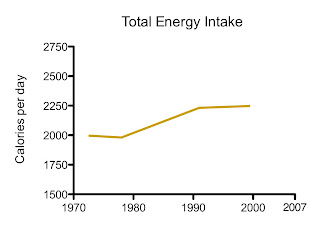
We're eating about 250 more calories per day, according to NHANES.
The 250 extra calories are coming from carbohydrate (NHANES).
We're eating more vegetables and fruit (USDA).
We're eating more meat by weight, although calories from meat have probably gone down because the meat has gotten leaner (USDA). This graph represents red meat, fish and poultry. The increase comes mostly from poultry. Boneless, skinless chicken breasts anyone?
We're eating more sugar (USDA). The scale of the graph doesn't allow you to fully appreciate that sweetener consumption had increased by a full 100 calories per day by 1999, although it has dropped a bit since then. This is based on food disappearance data. In other words, the amount consumed is estimated using the amount sold domestically, minus a percentage that approximates waste. High-fructose corn syrup has seized nearly 50% of the sweetener market since 1970.
Again, the scale of the graph doesn't allow you to fully appreciate the magnitude of the change here. In 2000, we ate approximately 2.5 ounces, or 280 calories, more processed grains per day than in 1970 (USDA). That has since decreased slightly (34 calories). You might be saying to yourself right now "hey, that plus the 100 calories from sugar adds up to more of an increase than the NHANES data show!" Yes, and I think that points to the fact that the data sets are not directly comparable. NHANES data are self-reported whereas USDA data are collected from vendors. Regardless of the absolute numbers, our processed grain consumption has gone way up since 1970.
Wheat is still king. Although we grow a lot of corn in this country, most of it gets fed to animals. We prefer eating wheat without first feeding it to an intermediary. In absolute quantity, wheat consumption has increased more than any other grain (not including corn syrup).
Bye bye whole milk. Hello skim milk (USDA).
This graph represents "added fats", as opposed to fats that occur naturally in meat or milk (the USDA does not track the latter). Added fats include salad oil, cooking oil, deep fry oil, butter, lard, tallow, etc. We are eating a lot more vegetable oil than we were in 1970. It comes chiefly from the industrial, omega-6 rich oils such as soybean, corn and canola. Added animal fats have increased slightly, but it's pretty insignificant in terms of calories.
There is an artifact in this graph that I have to point out. In 2000, the USDA changed the way it gathered vegetable oil data. This led to an abrupt, apparent increase in its consumption that is obvious on the graph. So it's difficult to make any quantitative conclusions, but I think it's clear nevertheless that vegetable oil intake has increased considerably.
Between 1970 and 1980, something changed in the U.S. that caused a massive increase in obesity and other health problems. Some combination of factors reached a critical mass that our metabolism could no longer tolerate. The three biggest changes in the American diet since 1970:
- An increase in cereal grain consumption, particularly wheat.
- An increase in sweetener consumption
- The replacement of meat and milk fat with industrial vegetable oils, with total fat intake remaining the same.
Saturday, December 13, 2008
The Myth of the High-Protein Diet
The phrase "low-carbohydrate diet" is a no-no in some circles, because it implies that a diet is high in fat. Often, the euphemism "high-protein diet" is used to avoid the mental image of a stick of butter wrapped in bacon. It's purely a semantic game, because there is no such thing as a diet in which the majority of calories come from protein. The ability of the human body to metabolize protein ends at about 1/3 of calories (1, 2), and the long-term optimum may be lower still. Low-carbohydrate diets (yes, the ones that are highly effective for weight loss and general health) are high-fat diets.
Healthy cultures around the world tend to consume roughly 10 to 20% of calories from protein:
Masai - 19%
Healthy cultures around the world tend to consume roughly 10 to 20% of calories from protein:
Masai - 19%
Kitava - 10%
Tokelau - 12%
Tokelau - 12%
Inuit - 20%, according to Stefansson
Kuna - 12%
Sweden - 12%
United States - 15%
Human milk - 6%
The balance comes from fat and carbohydrate. Ask a traditional Inuit. If there's no fat on your meat, you may as well starve. Literally. "Rabbit starvation" was a term coined by American explorers who quickly realized that living on lean game is somewhere between unhealthy and fatal.
In the early 1900s, anthropologist and explorer Vilhjalmur Stefansson lived for several years among completely isolated Canadian Inuit (Eskimo) who had never seen a white person before. They were literally a stone-age culture, completely uninfluenced by the modern world. They are representative of how some of our paleolithic ancestors would have lived. Here's Stefansson, quoted from My Life With the Eskimo (1913):
In certain places and in certain years, rabbits are an important article of diet, but even when there is an abundance of this animal, the Indians consider themselves starving if they get nothing else, - and fairly enough, as my own party can testify, for any one who is compelled in winter to live for a period of several weeks on lean meat will actually starve, in this sense: that there are lacking from his diet certain necessary elements, notably fat, and it makes no difference how much he eats, he will be hungry at the end of each meal, and eventually he will lose strength or become actually ill. The Eskimo who have provided themselves in summer with bags of seal oil can carry them into a rabbit country and can live on rabbits satisfactorily for months.
Dr. Loren Cordain, in his excellent paper "Plant-Animal Subsistence Ratios and Macronutrient Energy Estimations in Worldwide Hunter-Gatherer Diets", argues based on calculated estimates that historical hunter-gatherers generally consumed between 19 and 35% of calories from protein:
It's clear from the anthropological literature that hunter-gatherers did not go after representative animals. They went after the fattest animals they could find. They knew exactly which animals were fattest in which seasons, which individuals were likely to be fattest within a herd, and which bodyparts were fattest on an individual animal. For example, Stefansson describes how the Inuit relied on (extremely fat) seal in the spring, wolf in the summer, and caribou and bear in the fall and early winter. If necessary, they would discard lean meat in favor of tongue, marrow, internal organs, back fat and other fat-rich bodyparts. This was in order to obtain a minimum of 65% of calories from fat.
Hunter-gatherers would sometimes even provision themselves with enough fat in advance to last a lean season or two. This was true for dozens of tribes along the Northwest coast of North America that relied chiefly on animal foods. Here's another excerpt from My Life With the Eskimo:
Further, although the human body can theoretically tolerate up to 35% protein by calories, even that amount is probably not optimal in the long term. I think that's suggested by the fact that diverse cultures tend to find a source of fat and/or carbohydrate that keeps their protein intake roughly between 10 and 20%. I think it's fine to eat plenty of protein, and there's no need to deliberately restrict it, because your tastes will tell you if you're eating too much. However, "high-protein diet" as a euphemism for low-carbohydrate diet is a misnomer. Low-carbohydrate diets are, and have always been, high-fat diets.
This high reliance on animal-based foods coupled with the relatively low carbohydrate content of wild plant foods produces universally characteristic macronutrient composition ratios in which protein is elevated (19- 35% of energy) at the expense of carbohydrates (22- 40% of energy).Later, he states that the most plausible range of fat intakes is 28- 58%. I agree with his assertion that hunter-gatherer diets tended to be relatively high in protein compared with contemporary diets, but I think his protein numbers are a bit high. Why? Because he calculates macronutrient composition based on the whole-carcass fat content of "representative" animals such as deer.
It's clear from the anthropological literature that hunter-gatherers did not go after representative animals. They went after the fattest animals they could find. They knew exactly which animals were fattest in which seasons, which individuals were likely to be fattest within a herd, and which bodyparts were fattest on an individual animal. For example, Stefansson describes how the Inuit relied on (extremely fat) seal in the spring, wolf in the summer, and caribou and bear in the fall and early winter. If necessary, they would discard lean meat in favor of tongue, marrow, internal organs, back fat and other fat-rich bodyparts. This was in order to obtain a minimum of 65% of calories from fat.
Hunter-gatherers would sometimes even provision themselves with enough fat in advance to last a lean season or two. This was true for dozens of tribes along the Northwest coast of North America that relied chiefly on animal foods. Here's another excerpt from My Life With the Eskimo:
...[spring] is the season which the Eskimo give up to the accumulation of blubber for the coming year. Fresh oil is not nearly so palatable or digestible as oil that has been allowed to ferment in a sealskin bag through the summer, and besides that it is difficult often to get seals in the fall... Each family will in the spring be able to lay away from three to seven bags of oil. Such a bag consists of the whole skin of the common seal... This makes a bag which will hold about three hundred pounds of blubber, so that a single family's store of oil for the fall will run from nine hundred to two thousand pounds.That's a lot of oil! Some of it would have been used to light oil lamps, but much of it would have been eaten. I think Cordain's estimate of the protein intake of hunter-gatherers is a bit high due to his underestimating fat intake. His paper shows that if you break historical hunter-gatherer cultures into 10 groups based on their reliance on animal foods, the most numerous group (46 out of 229) obtained 85- 100% of their food from animal sources. In other words, approximately 20% of historical hunter-gatherers were carnivorous or nearly so. If the human protein ceiling is 35% of calories, that means roughly one fifth of hunter-gatherers ate 65% or more of their calories as fat. It also means carnivory and high-fat diets are not just anomalies, they are part of the human ecological niche. Zero out of 229 groups obtained less than 16% of calories from animal foods. Vegetarianism is not part of our niche.
Further, although the human body can theoretically tolerate up to 35% protein by calories, even that amount is probably not optimal in the long term. I think that's suggested by the fact that diverse cultures tend to find a source of fat and/or carbohydrate that keeps their protein intake roughly between 10 and 20%. I think it's fine to eat plenty of protein, and there's no need to deliberately restrict it, because your tastes will tell you if you're eating too much. However, "high-protein diet" as a euphemism for low-carbohydrate diet is a misnomer. Low-carbohydrate diets are, and have always been, high-fat diets.
Monday, December 8, 2008
Gluten Sensitivity: Celiac Disease is the Tip of the Iceberg
Celiac disease is a degeneration of the lining of the small intestine caused by a sensitivity to gluten. Gluten is the protein portion of wheat, rye, barley, and wheat relatives (spelt, kamut, emmer, einkorn and triticale). I found an interesting paper recently on the impact of celiac disease on nutrient status and bone density. Researchers compared 54 Northern Italian children with untreated celiac disease to 60 presumably healthy children. The celiac patients had extremely poor vitamin D status, with a deficiency rate of 35.18% compared to 5% in the control group. This was using the lenient cut-off point of 20 ng/mL. Average serum 25(OH)D3 in celiac patients was less than half the level of the control group. The celiac patients also had low serum calcium and magnesium, and elevated parathyroid hormone. Celiac children had lower bone mineral density. All parameters returned to normal after 6 months on a gluten-free diet.
This confirms what has been shown numerous times before: celiac disease interferes with nutrient status, including the all-important fat-soluble vitamins. It's not surprising, since it flattens the villi, finger-like structures necessary for efficient nutrient absorption in the small intestine. But wait, the overwhelming majority of our vitamin D comes from the effect of sunlight on our skin, not through our small intestine! So gluten sensitivity must be doing something besides just flattening villi. Perhaps it does. Feeding wheat bran to "healthy" volunteers caused them to burn through their vitamin D reserves at an accelerated rate. I think this underlines what I've come to believe about wheat: it's problematic for a large proportion of the population, perhaps the majority.
Approximately 12% of Americans can be diagnosed as gluten sensitive using blood antibody tests (anti-gliadin IgA or IgG). A subset of these have full-blown celiac disease. The vast, vast majority are undiagnosed. Gluten sensitivity associates with a dizzying array of diseases, including autoimmune disorders, cancer, and neurological problems. The problem with the blood tests is they aren't very sensitive. The most common blood tests for celiac disease look for a class of antibody called IgA. IgA is produced by the mucosa, including the gut. Unless gut damage is already extensive, the majority of IgA stays in the gut. This may cause the assay to overlook many cases of gluten sensitivity. A negative blood antibody test does not rule out gluten sensitivity!
I recently discovered the work of Dr. Kenneth Fine of EnteroLab. He has developed an assay that detects anti-gliadin IgA in stool. Gliadin is one of the problematic proteins in gluten that is implicated in gluten sensitivity. Dr. Fine has been conducting informal research using his fecal anti-gliadin IgA test (data here). He has found that:
- 100% of untreated celiac patients are antigliadin IgA positive by fecal test, compared to only 76% by blood (n= 17).
- 76% of microscopic colitis (a type of chronic diarrhea) patients are positive by the fecal test, compared to 9% by blood (n= 57).
- 57% of symptomatic people (digestive problems?) are positive by the fecal test, compared to 12% by blood (n= 58).
- 62% of people with autoimmune disease are positive by the fecal test.
- 29% of asymptomatic (healthy) people are positive by the fecal test, compared to 11-12% by blood (n= 240).
- Baby and cow feces are 0% positive by the stool assay.
It gets worse. Gluten sensitivity is determined in large part by genetics. A gene called HLA-DQ is intimately involved. It encodes a protein that is expressed on the surface of cells, that serves to activate immune cells when certain foreign substances are present. Different versions of the gene are activated by different substances. HLA-DQ2 and HLA-DQ8 are classically associated with celiac disease. Roughly 42% of the US population carries DQ2 or DQ8. According to Dr. Fine, every allele except DQ4 has some association with gluten-related problems! Only 0.4% of the U.S. population carries HLA-DQ4 and no other allele.
Not everyone who is genetically susceptible will end up developing health problems due to gluten, but it's impossible to estimate how many of the problems we attribute to other causes are in fact caused or exacerbated by gluten.
The immune system can be divided into two parts: innate and adaptive. The innate immune system is a nonspecific, first-line reaction to a perceived threat. The adaptive immune system is a more sophisticated, but slower system that produces a powerful response by particular cell types to a very specific threat. Antibody production is part of the adaptive immune system. Thus, if your gluten sensitivity test is looking for antibodies, it could still be missing an immune reaction to gluten mediated by the innate immune system!
This question has been addressed in a preliminary study. Researchers took gut biopsies from celiac patients and asymptomatic controls. Five out of six asymptomatic controls showed elevated interleukin-15, a marker of innate immune activation, upon exposure to gliadin. An activated innate immune system (commonly called 'inflammation') is associated with a wide array of chronic diseases, from obesity to cancer to cardiovascular disease. Inflammatory cytokines are elevated in celiac patients and may play a role in their bone pathology. What I would like to see is some negative controls-- would the gut biopsies have produced interleukin-15 in response to benign foods or is it truly specific to gluten?
I don't intend to imply that everyone has gluten sensitivity, but I do think the totality of the data are thought-provoking. They also include the association between the introduction of wheat to non-industrial populations and the development of widespread health problems. Another thing to keep in mind is that traditional sourdough fermentation breaks down a portion of gluten, possibly explaining the rise in gluten sensitivity that has paralleled a shift to quick-rise yeast breads. I believe that gluten sensitivity is behind many modern ills, and should be on the short list of suspects in the case of unexplained health problems. This is particularly true of digestive, autoimmune and neurological disorders. Gluten sensitivity is easy to address: stop eating gluten for a few weeks. See how you feel. Reintroduce gluten and see what happens. You might learn something about yourself.
Saturday, December 6, 2008
Peripheral vs. Ectopic Fat
I went to an interesting presentation the other day by Dr. George Ioannou of the University of Washington, on obesity and liver disease. He made an interesting distinction between the health effects of two types of body fat. The first is called subcutaneous fat (or peripheral fat). It accumulates right under the skin and is evenly distributed over the body's surface area, including extremities. The second is called ectopic fat. Ectopic means "not where it's supposed to be". It accumulates in the abdominal region (beer belly), the liver, muscle tissue including the heart, the pancreas, and perhaps in lipid-rich deposits in the arteries. Subcutaneous fat can be measured by taking skinfold thickness in different places on the body, or sometimes by measuring arm or leg circumference. Ectopic fat can be measured by taking waist circumference.
It's an absolutely critical distinction, because ectopic fat associates with poor health outcomes while subcutaneous fat does not. In this recent study, waist circumference was associated with increased risk of death while arm and leg circumference were associated with a reduced risk of death. I think the limb circumference association in this particular study is probably confounded by muscle mass, but other studies have also shown a strong, consistent association between ectopic fat and risk of death, but not subcutaneous fat. The same goes for dementia and a number of other diseases. I think it's more than an epidemiological asssociation. Surgically removing the abdominal fat from mice prevents insulin resistance and prolongs their lifespan.
People with excess visceral fat are also much more likely to have fatty liver and cirrhosis. It makes sense if you think of them both as manifestations of ectopic fat. There's a spectrum of disorders that goes along with excess visceral fat and fatty liver: it's called the metabolic syndrome, and it affects a quarter of Americans (NHANES III). We already have a pretty good idea of what causes fatty liver, at least in lab animals: industrial vegetable oils and sugar. What's the most widely used animal model of metabolic syndrome? The sugar-fed rat. What are two of the main foods whose consumption has increased in recent decades? Vegetable oil and sugar. Hmm... Fatty liver is capable of causing insulin resistance and diabetes, according to a transgenic mouse that expresses a hepatitis C protein in its liver.
You want to keep your liver happy. All those blood tests they do in the doctor's office to see if you're healthy-- cholesterol levels, triglycerides, insulin, glucose-- reflect liver function to varying degrees.
Abdominal fat is a sign of ectopic fat distribution throughout the body, and its associated metabolic consequences. I think we know it's unhealthy on a subconscious level, because belly fat is not attractive whereas nicely distributed subcutaneous fat can be. If you have excess visceral fat, take it as a sign that your body does not like your current lifestyle. It might be time to think about changing your diet and exercise regime. Here are some ideas.
Thursday, December 4, 2008
Update: Birthing Centre / Town Halls / Mental Health / Socials
By Rik Ganderton President and CEO
I have a few pieces of news to update you on today.
* Town Halls
First, sorry it's been so long since we've had a Town Hall. Scheduling of various meetings has got in the way. We will resume our regular monthly staff-physician-volunteer Town Halls on Thursday, Dec. 18 at each hospital campus:
- 9:30 a.m. at RVC's Dr. Bruce Johnston Conference Room; and
- 2 p.m. at RVAP's Conference Rooms B and C.
* Birthing and Newborn Centre at RVC
My congratulations to our RVHS Foundation team for their successful events on November 20 when volunteers were thanked for their tremendous $1 million support for the new centre and an evening event at which key donors and supporters were recognized. I would also like to acknowledge the work of the whole Women's and Children's Program team for all their efforts in making the new Birthing Centre a reality. While all have worked tirelessly I would especially like to thank
· Julie Goldstein, Program Director (now with the TMO)
· Sue Fyfe, Program Director
· Penny Katz, Manager, Perinatal
· Sheri Ferkl, Manager, Paediatrics
· Rose Owen, Clinical Practice Leader
· Debbie MacInnes, Clinical Practice Leader
· Debbie Lopresti, Resource Nurse, Perinatal
· Kim Eeuwes, Resource Nurse, NICU
· Amer Syed, Manager, Respiratory Therapy
· Dan Flood, Purchasing
· Nicki Modeste, Purchasing
· Rick Gowrie, Senior Director
· Ed Carroll, Manager - Plant Admin, Projects
· Martin Green, Manager, Security
· Siamak Sadr, Director
· Teresa Alzner, Resource Nurse, Paediatrics
· Kim Kaizer, Clinical Practice Leader, RVAP
· Mary Ellen Stevenson, Manager, RVAP
We look forward to having the official grand opening of the centre early in the 2009 and subject to the availability of government leaders. We'll announce the date as soon as possible.
It is indeed a beautiful facility which we can be proud of.
* Mental Health improvements
Our implementation of the plan announced in March continues to move forward.
Rouge Valley also continues to look for opportunities presented by the improved mental health service model.
We have asked the Central East LHIN (in June 2008) to fund the hospital for 29 additional acute care medical beds to go into the space being vacated as part of our improved model of care. It is our intention to house 22 of these beds on RVAP's 3 West, if they are funded.
We desperately need this medical bed capacity to improve the flow of patients through our emergency department. Durham region has some of the lowest rates of admission to inpatient medical beds in the province. When compared to other centres it appears we are substantially under resourced in terms of inpatient acute medicine bed capacity.
We'll let you know when we have an answer from the Central East LHIN on our request.
* Rouge Holiday Socials
I hope to see you at our annual Rouge Holiday Socials for all staff, physicians, board members, and volunteers.
The socials are:
- Dec. 15, 2-4 p.m. at RVAP’s Conference Rooms B and C. Plus we'll have a traveling minstrel and holiday food going floor to floor from 7:30 p.m. to 9:30 p.m.
- Dec. 16, 2-4 p.m.. at RVC's Dr. Bruce Johnston Room. Plus we'll have a traveling minstrel and holiday food going floor to floor from 7:30 p.m. to 9:30 p.m.
This is purely an end of the year social event. I'll put way my projector and PowerPoint. Please come and enjoy some good food, good music and equally good conversation!
Wednesday, December 3, 2008
Polyunsaturated Fat Intake: What About Humans?
Now we know how to raise a healthy pig or rat: balance omega-6 linoleic acid (LA) and omega-3 alpha-linolenic acid (LNA) and keep both relatively low. LA and LNA are the most basic (and shortest) forms of omega-6 and omega-3 fats. They are the only fats the body can't make on its own. They're found in plant foods, and animal foods to a lesser extent. Animals convert them to longer-chain fats like arachidonic acid (AA; omega-6), EPA (omega-3) and DHA (omega-3). These long-chain, animal PUFA are involved in a dizzying array of cellular processes. They participate directly as well as being further elongated to form eicosanoids, a large class of very influential signaling molecules.
AA is the precursor of a number of inflammatory eicosanoids, while omega-3-derived eicosanoids tend to be less inflammatory and participate in long-term repair processes. A plausible explanation for the negative health effects of LA-rich vegetable oils is the fact that they lead to an imbalance in cellular signaling by increasing the formation of AA and decreasing the formation of EPA and DHA. Both inflammatory and anti-inflammatory signaling are necessary in the proper context, but they must be in balance for optimal function. Many modern diseases involve excess inflammation. LA also promotes oxidative and nitrosative damage to organs, as explained in the last post. This is an enormous oversimplification, but I'll skip over the details (most of which I don't know) because they could fill a stack of textbooks.
How do we raise a healthy human? Although I think pigs are a decent model organism for studying diet and health as it relates to humans, they don't have as much of a carnivorous history as we do. You would expect them to be more efficient at converting plant nutrients to their animal counterparts: carotenes to vitamin A, vitamin K1 to K2, and perhaps short-chain polyunsaturated fats (PUFA) to long-chain fats like AA, EPA and DHA. I mention it simply to point out that what goes for a pig may not necessarily go for a human when it comes to fatty acid conversion.
I've dug up a few papers exploring this question. I don't intend this post to be comprehensive but I think it's enough to get a flavor of what's going on. The first paper is an intervention trial comparing the effect of flax oil and fish oil supplementation on the fat composition of red blood cells. Investigators gave volunteers either 1.2 g, 2.4 g or 3.6 g (one teaspoon) flax oil per day; or 0.6 g or 1.2 g fish oil per day. The volunteers were U.S. firefighters, who otherwise ate their typical diet rich in omega-6. Flax oil supplementation at the two higher doses increased EPA, but did not increase DHA or decrease AA significantly. This suggests that humans can indeed convert some ALA to long-chain omega-3 fats, but adding ALA to a diet that is already high in omega-6 does not reduce AA or increase the all-important DHA.
The fish oil supplement, even at one-sixth the highest flax oil dose, increased EPA and DHA to a greater extent than flax oil, and also decreased AA. This shows that fish oil has a greater effect than flax oil on the fat profile of red blood cells in the context of a diet rich in omega-6. Another study also found that ALA intake is not associated with EPA or DHA in blood plasma. This could suggest either that humans aren't very good at converting ALA to longer n-3 fats, that the pathways are blocked by excessive LA or some other factor (a number of things block conversion of omega-3 fats), or that our bodies are already converting sufficient omega-3 and fish oil is overkill.
What happens when you reduce omega-6 consumption while increasing omega-3? In one study, participants were put on a "high LA" or "low LA" (3.8% of calories) diet. The first had an omega-6 : omega-3 ratio of 10.1, while the second had a ratio of 4.0. As in the previous intervention study, EPA was higher on the low LA diet. Here's where it gets interesting: DHA levels fell precipitously throughout the study, regardless of which diet the participants were eating. This has to do with a special requirement of the study diet: participants were not allowed to eat seafood. This shows that most of the DHA in the blood is obtained by eating DHA from animal fat, rather than elongating it from ALA such as flax oil. This agrees with the finding that strict vegetarians (vegans) have a low level of DHA in blood plasma.
In another intervention study, researchers achieved a better omega-6 : omega-3 ratio, with participants going from a baseline ratio of 32.2 to an experimental ratio of 2.2 for 10 weeks. The change in ratio was mostly from increasing omega-3, rather than decreasing omega-6. This caused an increase in serum EPA and DHA, although the DHA did not quite reach statistical significance (p= 0.06). In this study, participants were encouraged to eat fish 3 times per week, which is probably the reason their DHA rose. Participants saw a metabolic shift to fat burning, and an increase in insulin sensitivity that was on the cusp of statistical significance (p= 0.07).
I think what the data suggest is that humans can convert short-chain omega-3 (ALA) to EPA, but we don't efficiently elongate it to DHA. At least in the context of a high LA intake. Another thing to keep in mind is that serum PUFA are partially determined by what's in fat tissue. Modern Americans have an abnormally high proportion of LA in their fat tissue, sometimes over 20%. This contributes to a higher proportion of omega-6 and its derivatives in all tissues. "Wild" humans, including our paleolithic ancestors, would probably have values in the lower single digits. LA in fat tissue has a half-life of about 2 years, so restoring balance is a long-term process. Omega-3 fats do not accumulate to the same degree as LA, typically comprising about 1% of fat tissue. At this point, one could rightly ask: we know how diet affects blood polyunsaturated fats, but what's the relevance to health? There are multiple lines of evidence, all of which point in generally the same direction in my opinion.
There are strong, consistent associations between omega-6 intake (from vegetable oils), low omega-3 intake, and a number of health and psychiatric problems. Another line of evidence comes from intervention trials. The Lyon diet-heart study was one of the most successful intervention trials of all time. The experimental group increased their intake of fish, poultry, root vegetables, green vegetables, bread and fruit, while decreasing intake of red meat and dairy fat. A key difference between this study and other intervention trials is that participants were encouraged to eat a margarine rich in omega-3 ALA. In sum, participants decreased their total PUFA intake, decreased omega-6 intake and increased intake of ALA and long-chain omega-3s. After an average of 27 months, total mortality was 70% lower in the intervention group than in the control group eating the typical diet! This effect was not seen in trials that encouraged vegetable and grain consumption, discouraged red meat and dairy fat consumption, but didn't alter PUFA intake or the omega-6 : omega-3 ratio, such as the Women's Health Initiative.
As usual, the most important line of evidence comes from healthy non-industrial cultures that did not suffer from modern non-communicable diseases. They invariably consumed very little omega-6 LA (3% of calories or less), ate a roughly balanced amount of omega-6 and omega-3, and had a source of long-chain (animal) omega-3. They did not eat much omega-3 from plant sources (such as flax), as concentrated sources are rare in nature. Dr. Weston Price observed that cultures throughout the world sought out seafood if available, sometimes going to great lengths to obtain it. Here's an exerpt from Nutrition and Physical Degeneration about Fiji islanders:
Since Viti Levu, one of the islands of this group, is one of the larger islands of the Pacific Ocean, I had hoped to find on it a district far enough from the sea to make it necessary for the natives to have lived entirely on land foods. Accordingly, with the assistance of the government officials and by using a recently opened government road I was able to get well into the interior of the island by motor vehicle, and from this point to proceed farther inland on foot with two guides. I was not able, however, to get beyond the piles of sea shells which had been carried into the interior. My guide told me that it had always been essential, as it is today, for the people of the interior to obtain some food from the sea, and that even during the times of most bitter warfare between the inland or hill tribes and the coast tribes, those of the interior would bring down during the night choice plant foods from the mountain areas and place them in caches and return the following night and obtain the sea foods that had been placed in those depositories by the shore tribes. The individuals who carried these foods were never molested, not even during active warfare. He told me further that they require food from the sea at least every three months, even to this day. This was a matter of keen interest, and at the same time disappointment since one of the purposes of the expedition to the South Seas was to find, if possible, plants or fruits which together, without the use of animal products, were capable of providing all of the requirements of the body for growth and for maintenance of good health and a high state of physical efficiency.
Price searched for, but did not find, vegetarian groups that were free of the diseases of civilization. What he found were healthy cultures that put a strong emphasis on nutrient-dense animal foods, particularly seafoods when available. I think all this information together suggests that the optimum, while being a fairly broad range, is a low intake of omega-6 LA (less than 3% of calories) and a modest intake of animal omega-3 for DHA.
I believe the most critical element is reducing omega-6 LA by eliminating industrial vegetable oils (soybean, corn, cottonseed, etc.) and the foods that contain them from the diet. Fats from pasture-raised ruminants (butter, beef, lamb etc.) and wild fish are naturally balanced. We no longer commonly eat the most concentrated land source of DHA, brain, so I think it's wise to eat seafood sometimes. According to the first study I cited, 1/4 teaspoon of fish oil (or cod liver oil) per day is enough to elevate plasma DHA quite significantly. This amount of omega-3 could be obtained by eating seafood weekly.
Sunday, November 30, 2008
Polyunsaturated Fat Intake: Effects on the Heart and Brain
I'm revisiting the topic of the omega-6/omega-3 balance and total polyunsaturated fat (PUFA) intake because of some interesting studies I've gotten a hold of lately (thanks Robert). Two of the studies are in pigs, which I feel are a decent model organism for studying the effect of diet on health as it relates to humans. Pigs are omnivorous (although more slanted toward plant foods), have a similar digestive system to humans (although sturdier), are of similar size and fat composition to humans, and have been eating grains for about the same amount of time as humans.
In the last post on the omega-6/omega-3 balance, I came to the conclusion that a roughly balanced but relatively low intake of omega-6 and omega-3 fats is consistent with the diets of healthy non-industrial cultures. There were a few cultures that had a fairly high long-chain omega-3 intake from seafood (10% of calories), but none ate much omega-6.
The first study explores the effect of omega-6 and omega-3 fats on heart function. Dr. Sheila Innis and her group fed young male pigs three different diets:
The most striking finding of all was the difference in lipid peroxidation between groups. Lipid peroxidation is a measure of oxidative damage to cellular fats. In the balanced diet hearts, peroxidation was half the level found in the first group, and one-third the level found in the third group! This shows that omega-3 fats exert a powerful anti-oxidant effect that can be more than counteracted by excessive omega-6. Nitrosative stress, another type of damage, tracked with n-6 intake regardless of n-3, with the third group almost tripling the first two. I think this result is highly relevant to the long-term development of cardiac problems, and perhaps cardiovascular disease in general.
In another study with the same lead author Sanjoy Ghosh, rats fed a diet enriched in omega-6 from sunflower oil showed an increase in nitrosative damage, damage to mitochondrial DNA, and a decrease in maximum cardiac work capacity (i.e., their hearts were weaker). This is consistent with the previous study and shows that the mammalian heart does not like too much omega-6! The amount of sunflower oil these rats were eating (20% food by weight) is not far off from the amount of industrial oil the average American eats.
A third paper by Dr. Sheila Innis' group studied the effect of the omega-6 : omega-3 balance on the brain fat composition of pigs, and the development of neurons in vitro (in a culture dish). There were four diets, the first three similar to those in the first study:
The researchers then cultured neurons and showed that they require DHA to develop properly in culture, and that long-chain omega-6 fats are a poor substitute. Overall, the paper shows that the modern diet causes a major fatty acid imbalance in the brain, which is expected to lead to developmental problems and probably others as well. This can be partially corrected by supplementing with fish oil.
Together, these studies are a small glimpse of the countless effects we are having on every organ system, by eating fats that are unfamiliar to our pre-industrial bodies. In the next post, I'll put this information into the context of the modern human diet.
In the last post on the omega-6/omega-3 balance, I came to the conclusion that a roughly balanced but relatively low intake of omega-6 and omega-3 fats is consistent with the diets of healthy non-industrial cultures. There were a few cultures that had a fairly high long-chain omega-3 intake from seafood (10% of calories), but none ate much omega-6.
The first study explores the effect of omega-6 and omega-3 fats on heart function. Dr. Sheila Innis and her group fed young male pigs three different diets:
- An unbalanced, low PUFA diet. Pig chow with 1.2% linoleic acid (LA; the main omega-6 plant fat) and 0.06% alpha linolenic acid (ALA; the main omega-3 plant fat).
- A balanced, low PUFA diet. Pig chow with 1.4% LA and 1.2% ALA.
- An unbalanced, but better-than-average, "modern diet". Pig chow with 11.6% LA and 1.2% ALA.
The most striking finding of all was the difference in lipid peroxidation between groups. Lipid peroxidation is a measure of oxidative damage to cellular fats. In the balanced diet hearts, peroxidation was half the level found in the first group, and one-third the level found in the third group! This shows that omega-3 fats exert a powerful anti-oxidant effect that can be more than counteracted by excessive omega-6. Nitrosative stress, another type of damage, tracked with n-6 intake regardless of n-3, with the third group almost tripling the first two. I think this result is highly relevant to the long-term development of cardiac problems, and perhaps cardiovascular disease in general.
In another study with the same lead author Sanjoy Ghosh, rats fed a diet enriched in omega-6 from sunflower oil showed an increase in nitrosative damage, damage to mitochondrial DNA, and a decrease in maximum cardiac work capacity (i.e., their hearts were weaker). This is consistent with the previous study and shows that the mammalian heart does not like too much omega-6! The amount of sunflower oil these rats were eating (20% food by weight) is not far off from the amount of industrial oil the average American eats.
A third paper by Dr. Sheila Innis' group studied the effect of the omega-6 : omega-3 balance on the brain fat composition of pigs, and the development of neurons in vitro (in a culture dish). There were four diets, the first three similar to those in the first study:
- Deficient. 1.2% LA and 0.05% ALA.
- Contemporary. 10.7% LA and 1.1% ALA.
- Evolutionary. 1.2% LA and 1.1% ALA.
- Supplemented. The contemporary diet plus 0.3% AA and 0.3% DHA.
The researchers then cultured neurons and showed that they require DHA to develop properly in culture, and that long-chain omega-6 fats are a poor substitute. Overall, the paper shows that the modern diet causes a major fatty acid imbalance in the brain, which is expected to lead to developmental problems and probably others as well. This can be partially corrected by supplementing with fish oil.
Together, these studies are a small glimpse of the countless effects we are having on every organ system, by eating fats that are unfamiliar to our pre-industrial bodies. In the next post, I'll put this information into the context of the modern human diet.
Wednesday, November 26, 2008
Health is Multi-Factorial
Thanks to commenter Brock for pointing me to this very interesting paper, "Effects of fish oil on hypertension, plasma lipids, and tumor necrosis factor-alpha in rats with sucrose-induced metabolic syndrome". As we know, sugar gives rats metabolic syndrome when it's added to regular rat chow, probably the same thing it does to humans when added to a processed food diet.
One thing has always puzzled me about sugar. It doesn't appear to cause major metabolic problems when added to an otherwise healthy diet, yet it wreaks havoc in other contexts. One example of the former situation is the Kuna, who are part hunter-gatherer, part agricultural. They eat a lot of refined sugar, but in the context of chocolate, coconut, fish, plantains, root vegetables and limited grains and beans, they are relatively healthy. Perhaps not quite on the same level as hunter-gatherer groups, but healthier than the average modernized person from the point of view of the diseases of civilization.
This paper really sheds light on the matter. The researchers gave a large group of rats access to drinking water containing 30% sucrose, in addition to their normal rat chow, for 21 weeks. The rats drank 4/5 of their calories in the form of sugar water. There's no doubt that this is an extreme treatment. They subsequently developed metabolic syndrome, including abdominal obesity, elevated blood pressure, elevated fasting insulin, elevated triglycerides, elevated total cholesterol and LDL, lowered HDL, greatly increased serum uric acid, greatly elevated liver enzymes suggestive of liver damage, and increased tumor necrosis factor-alpha (TNF-alpha). TNF-alpha is a hormone secreted by visceral (abdominal) fat tissue that may play a role in promoting insulin resistance.
After this initial 12-week treatment, they divided the metabolic syndrome rats into two groups:
- One that continued the sugar treatment, along with a diet enriched in corn and canola oil (increased omega-6).
- A second that continued the sugar treatment, along with a diet enriched in fish oil (increased omega-3).
The two diets contained the same total amount of polyunsaturated fat (PUFA), but had very different omega-6 : omega-3 ratios. The first had a ratio of 9.3 (still better than the average American), while the second had a ratio of 0.02, with most of the omega-3 in the second group coming from EPA and DHA (long-chain, animal omega-3s). The second diet also contained four times as much saturated fat as the first, mostly in the form of palmitic acid.
Compared to the vegetable oil group, the fish oil group had lower fasting insulin, lower blood pressure, lower triglycerides, lower cholesterol, and lower LDL. As a matter of fact, the fish oil group looked as good or better on all these parameters than a non-sugar fed control group receiving the extra vegetable oil alone (although the control group isn't perfect because it inevitably ate more vegetable oil-containing chow to make up for the calories it wasn't consuming in sugar). The only things reducing vegetable oil and increasing fish oil didn't fix were the weight and the elevated TNF-alpha, although they didn't report the level of liver enzymes in these groups. The TNF-alpha finding is not surprising, since it's secreted by visceral fat, which did not decrease in the fish oil group.
I think this is a powerful result. It may have been done in rats, but the evidence is there for a similar mechanism in humans. The Kuna have a very favorable omega-6 : omega-3 ratio, with most of their fat coming from highly saturated coconut and cocoa. This may protect them from their high sugar intake. The Kitavans also have a very favorable omega-6 : omega-3 ratio, with most of their fat coming from coconuts and fish. They don't eat refined sugar, but they do eat a tremendous amount of starch and a generous amount of fruit.
The paper also suggests that the metabolic syndrome is largely reversible.
I believe that both excessive sugar and excessive omega-6 from modern vegetable oils are a problem individually. But if you want to have a much bigger problem, try combining them!
Monday, November 24, 2008
Real Food X: Roasted Marrow Bones
Bone marrow is a food that has been prized throughout history-- from hunter-gatherer tribes to haute cuisine chefs. It's not hard to understand why, once you've tasted it. It's delicate, meaty and fatty. It's also rich in fat-soluble vitamins, including vitamins K1 and K2, although this will depend on what the animal has eaten.
Roasted marrow bones make a simple appetizer. Beef bones are the best because of their size. Select wide bones that are cut about three inches long. They should be from the femur or the humerus, called the "shank bones". These are sometimes available in the frozen meats section of a grocery store, otherwise a butcher can procure them. If you have access to a farmer's market that sells meats, vendors will typically have bones cut for you if you request it.
Recipe
- Preheat oven to 450 F (230 C).
- Place bones, cut side up, in a baking dish or oven-proof skillet.
- Bake for about 15 minutes, until the marrow begins to separate from the bone, but not much longer because it will turn to mush.
- Scoop out and eat the marrow by itself, on sourdough rye toast or however you please.
- Make soup stock from the leftover bones.
Saturday, November 22, 2008
Vitamin K2 in Marrow
I'm always on the lookout for foods rich in vitamin K2 MK-4, because it's so important and so rare in the modern food system. I heard some internet rumors that marrow might be rich in fat-soluble vitamins. Google let me down, so I decided to look through the rat studies on K2 MK-4 in which they looked at its tissue distribution.
I found one that looked at the K2 MK-4 content in different tissues of rats fed vitamin K1. Marrow was rich in K2, along with testes. It contains 10-20 times more MK-4 than liver by weight, and more than any of the other organs they tested (serum, liver, spleen, kidney, heart, testes, marrow, brain) except testes. They didn't include values for salivary gland and pancreas, the two richest sources.
If we assume beef marrow has the same amount of MK-4 as rat marrow per weight (I have no idea if this is really the case, but it's probably in the ballpark), two ounces of beef marrow would contain about 10 micrograms MK-4. Not a huge source, but significant nevertheless.
Bone marrow was a prized food in many hunter-gatherer societies. Let's see what Dr. Weston Price has to say about it (from Nutrition and Physical Degeneration):
For the Indians living inside the Rocky Mountain Range in the far North of Canada, the successful nutrition for nine months of the year was largely limited to wild game, chiefly moose and caribou. During the summer months the Indians were able to use growing plants. During the winter some use was made of bark and buds of trees. I found the Indians putting great emphasis upon the eating of the organs of the animals, including the wall of parts of the digestive tract. Much of the muscle meat of the animals was fed to the dogs. It is important that skeletons are rarely found where large game animals have been slaughtered by the Indians of the North. The skeletal remains are found as piles of finely broken bone chips or splinters that have been cracked up to obtain as much as possible of the marrow and nutritive qualities of the bones. These Indians obtain their fat-soluble vitamins and also most of their minerals from the organs of the animals. An important part of the nutrition of the children consisted in various preparations of bone marrow, both as a substitute for milk and as a special dietary ration.Here's a bit more about these same groups, also from Nutrition and Physical Degeneration:
The condition of the teeth, and the shape of the dental arches and the facial form, were superb. Indeed, in several groups examined not a single tooth was found that had ever been attacked by tooth decay. In an examination of eighty-seven individuals having 2,464 teeth only four teeth were found that had ever been attacked by dental caries. This is equivalent to 0.16 per cent. As we came back to civilization and studied, successively, different groups with increasing amounts of contact with modern civilization, we found dental caries increased progressively, reaching 25.5 per cent of all of the teeth examined at Telegraph Creek, the point of contact with the white man's foods. As we came down the Stikine River to the Alaskan frontier towns, the dental caries problem increased to 40 per cent of all of the teeth.Evidently, the traditionally-living groups were doing something right.
Wednesday, November 19, 2008
The Fructose Index is the New Glycemic Index
I stumbled upon an interesting editorial recently in the American Journal of Clinical Nutrition from Dr. Richard Johnson's group, entitled "How Safe is Fructose for Persons With or Without Diabetes?" It was a response to a meta-analysis in the same journal pronouncing fructose safe up to 90 grams per day. That's the amount in eight apples or four cans of soda. Not quite what our hunter-gatherer ancestors were eating! The editorial outlined the case against excessive fructose, which I feel is quite strong. That led me to another, more comprehensive paper from Dr. Johnson's group, which argues that the amount of fructose found in a food, which they call the "fructose index", is more relevant to health than the food's glycemic index.
The glycemic index is a measure of the blood sugar response to a fixed amount of carbohydrate from a particular food. For example, white bread has a high glycemic index because it raises blood sugar more than another food containing the same amount of carbohydrate, say, lentils. Since chronically elevated blood sugar and its natural partner, insulin resistance, are part of the metabolic syndrome, it made sense that the glycemic index would be a good predictor of the metabolic effect of a food. I believed this myself for a long time.
My faith in the concept began to erode when I learned more about the diets of healthy traditional cultures. For example, the Kitavans get 69% of their calories from high-glycemic index carbohydrates (mostly starchy root vegetables), with little added fat-- that's a lot of fast-digesting carbohydrate! Overweight, elevated insulin and other symptoms of the metabolic syndrome are essentially nonexistent. Throughout Africa, healthy cultures make dishes from grains or starchy tubers that are soaked, pounded, fermented and then cooked. The result is a pile of mush that is very easily absorbed by the digestive tract, which is exactly the point of going through all the trouble.
The more I thought about the glycemic index and its relationship to insulin resistance and the metabolic syndrome, the more I realized there is a disconnect in the logic: elevated post-meal glucose and insulin do not necessarily lead to chronically elevated glucose and insulin. Here's what Dr. Mark Segal from Dr. Johnson's group had to say:
Well said! I decided to take a look through the literature to see if there had been any trials on the relationship between a diet's glycemic index and its ability to cause satiety (fullness) and affect weight. I found a meta-analysis from 2007. Two things are clear from the paper: 1) in the short term, given an equal amount of carbohydrate, a diet with a low glycemic index is more satiating (filling) than one with a high glycemic index, leading to a lower intake of calories. 2) this effect disappears in the long-term, and the three trials (1, 2, 3) lasting 10 weeks or longer found no consistent effect on caloric intake or weight*. As a matter of fact, the only statistically significant (p less than 0.001) weight difference was a greater weight loss in one of the high-glycemic index groups!
As I've said many times, the body has mechanisms for maintaining weight and caloric intake where they should be in the long term. As long as those mechanisms are working properly, weight and caloric intake will be appropriate. The big question is, how does the modern lifestyle derail those mechanisms?
Dr. Johnson believes fructose is a major contributor. Table sugar, fruit, high-fructose corn syrup and honey are all roughly 50% fructose by calories. Total fructose consumption has increased about 19% in the U.S. since 1970, currently accounting for almost one eighth of our total calorie intake (total sugars account for one quarter!). That's the average, so many people actually consume more.
Fructose, but not starch or its component sugar glucose, causes insulin resistance, elevated serum uric acid (think gout and kidney stones), poorer blood glucose control, increased triglycerides and LDL cholesterol in animal studies and controlled human trials. All of these effects relate to the liver, which clearly does not like excessive fructose (or omega-6 oils). Some of these trials were conducted using doses that are near the average U.S. intake. The effect seems to compound over time both in humans and animals. The overweight, the elderly and the physically unfit are particularly vulnerable. I find this pretty damning.
Drs. Johnson and Segal recommend limiting fructose to 15-40 grams per day, which is the equivalent of about two apples or one soda (choose the apples!). They also recommend temporarily eliminating fructose for two weeks, to allow the body to recover from the negative long-term metabolic adaptation that can persist even when intake is low. I think this makes good sense.
The glycemic index may still be a useful tool for people with poor glucose control, like type II diabetics, but I'm not sure how much it adds to simply restricting carbohydrate. Reducing fructose may be a more effective way to address insulin resistance than eating a low glycemic index diet.
*Here was the author's way of putting it in the abstract: "Because of the increasing number of confounding variables in the available long-term studies, it is not possible to conclude that low-glycaemic diets mediate a health benefit based on body weight regulation. The difficulty of demonstrating the long-term health benefit of a satietogenic food or diet may constitute an obstacle to the recognition of associated claims." In other words, the data not supporting our favorite hypothesis is an obstacle to its recognition. You don't say?
The glycemic index is a measure of the blood sugar response to a fixed amount of carbohydrate from a particular food. For example, white bread has a high glycemic index because it raises blood sugar more than another food containing the same amount of carbohydrate, say, lentils. Since chronically elevated blood sugar and its natural partner, insulin resistance, are part of the metabolic syndrome, it made sense that the glycemic index would be a good predictor of the metabolic effect of a food. I believed this myself for a long time.
My faith in the concept began to erode when I learned more about the diets of healthy traditional cultures. For example, the Kitavans get 69% of their calories from high-glycemic index carbohydrates (mostly starchy root vegetables), with little added fat-- that's a lot of fast-digesting carbohydrate! Overweight, elevated insulin and other symptoms of the metabolic syndrome are essentially nonexistent. Throughout Africa, healthy cultures make dishes from grains or starchy tubers that are soaked, pounded, fermented and then cooked. The result is a pile of mush that is very easily absorbed by the digestive tract, which is exactly the point of going through all the trouble.
The more I thought about the glycemic index and its relationship to insulin resistance and the metabolic syndrome, the more I realized there is a disconnect in the logic: elevated post-meal glucose and insulin do not necessarily lead to chronically elevated glucose and insulin. Here's what Dr. Mark Segal from Dr. Johnson's group had to say:
We suggest that the [glycemic index] is better aimed at identifying foods that stimulate insulin secretion rather than foods that stimulate insulin resistance. The underlying concept is based on the principle that it is the ingestion of foods that induce insulin resistance that carries the increased risk for obesity and cardiovascular disease and not eating foods that stimulate insulin secretion.
Well said! I decided to take a look through the literature to see if there had been any trials on the relationship between a diet's glycemic index and its ability to cause satiety (fullness) and affect weight. I found a meta-analysis from 2007. Two things are clear from the paper: 1) in the short term, given an equal amount of carbohydrate, a diet with a low glycemic index is more satiating (filling) than one with a high glycemic index, leading to a lower intake of calories. 2) this effect disappears in the long-term, and the three trials (1, 2, 3) lasting 10 weeks or longer found no consistent effect on caloric intake or weight*. As a matter of fact, the only statistically significant (p less than 0.001) weight difference was a greater weight loss in one of the high-glycemic index groups!
As I've said many times, the body has mechanisms for maintaining weight and caloric intake where they should be in the long term. As long as those mechanisms are working properly, weight and caloric intake will be appropriate. The big question is, how does the modern lifestyle derail those mechanisms?
Dr. Johnson believes fructose is a major contributor. Table sugar, fruit, high-fructose corn syrup and honey are all roughly 50% fructose by calories. Total fructose consumption has increased about 19% in the U.S. since 1970, currently accounting for almost one eighth of our total calorie intake (total sugars account for one quarter!). That's the average, so many people actually consume more.
Fructose, but not starch or its component sugar glucose, causes insulin resistance, elevated serum uric acid (think gout and kidney stones), poorer blood glucose control, increased triglycerides and LDL cholesterol in animal studies and controlled human trials. All of these effects relate to the liver, which clearly does not like excessive fructose (or omega-6 oils). Some of these trials were conducted using doses that are near the average U.S. intake. The effect seems to compound over time both in humans and animals. The overweight, the elderly and the physically unfit are particularly vulnerable. I find this pretty damning.
Drs. Johnson and Segal recommend limiting fructose to 15-40 grams per day, which is the equivalent of about two apples or one soda (choose the apples!). They also recommend temporarily eliminating fructose for two weeks, to allow the body to recover from the negative long-term metabolic adaptation that can persist even when intake is low. I think this makes good sense.
The glycemic index may still be a useful tool for people with poor glucose control, like type II diabetics, but I'm not sure how much it adds to simply restricting carbohydrate. Reducing fructose may be a more effective way to address insulin resistance than eating a low glycemic index diet.
*Here was the author's way of putting it in the abstract: "Because of the increasing number of confounding variables in the available long-term studies, it is not possible to conclude that low-glycaemic diets mediate a health benefit based on body weight regulation. The difficulty of demonstrating the long-term health benefit of a satietogenic food or diet may constitute an obstacle to the recognition of associated claims." In other words, the data not supporting our favorite hypothesis is an obstacle to its recognition. You don't say?
Subscribe to:
Posts (Atom)